Making prediction market activity easier to inspect.
PolyGains brings market trades, wallet activity, unusual flow alerts, and trader analytics into a working public terminal. As a co-developer, I work on its backend data streaming and quantitative analysis.
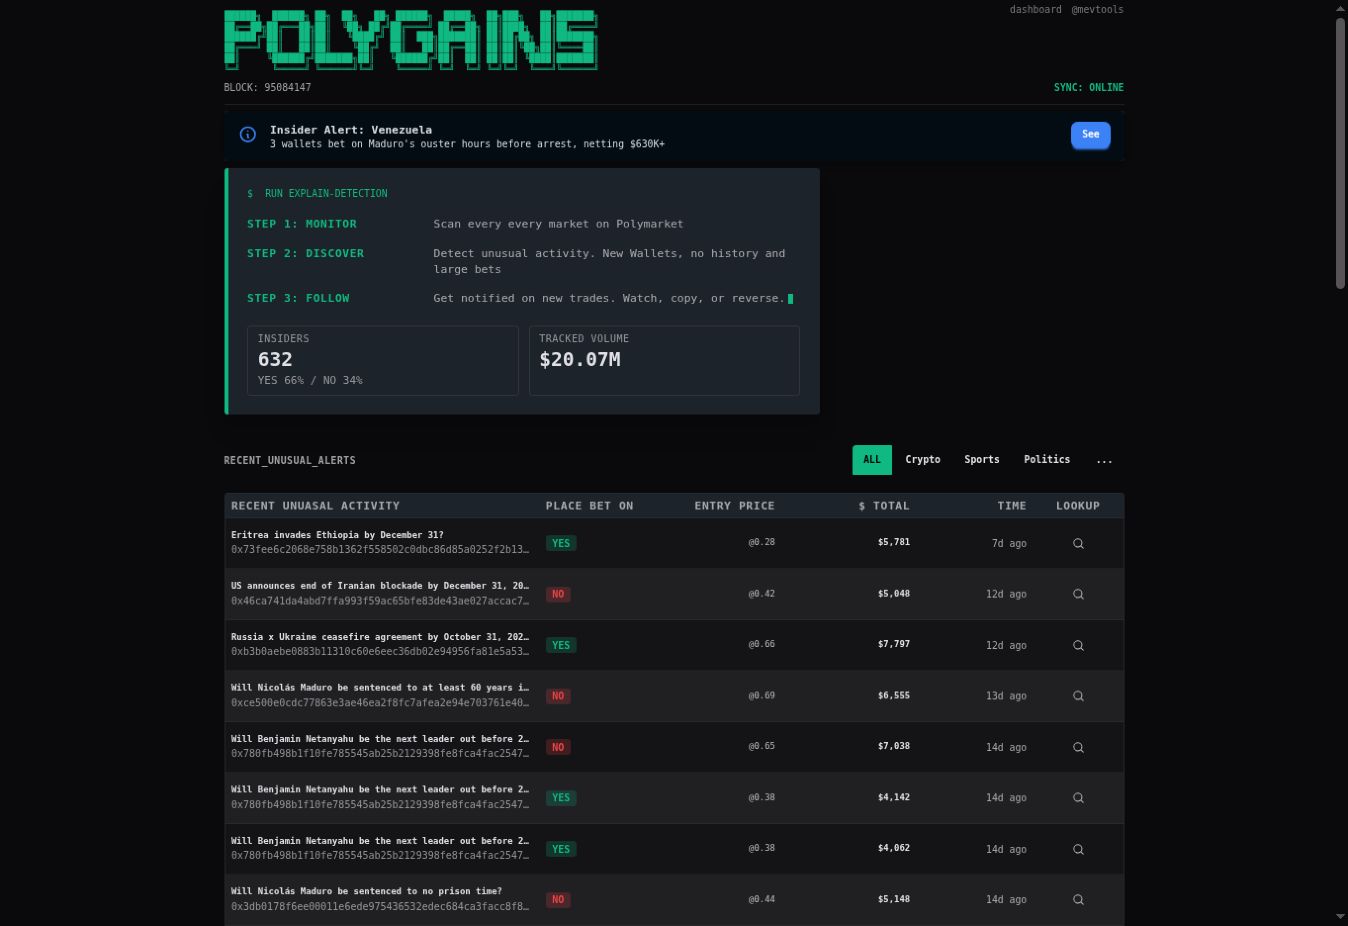
Raw activity is hard to follow.
Prediction market activity spans markets, matched orders, and wallet addresses. Looking at one trade in isolation gives little context about the market or the trader behind it. The product helps visitors move from an unusual event to the related market and wallet activity.
From data to inspection.
I built data streaming pipelines for transaction ingestion, order flow, and wallet clustering, then helped surface that information in interfaces people can explore. PolyGains brings those strands together as alerts, market summaries, and trader views.
What the public product shows
Market activity moves through indexing and analysis before it reaches the terminal.
- 01Market activity
Matched orders and wallet transactions on Polymarket.
- 02Index and organize
Bring activity into market, trade, and wallet views.
- 03Flag patterns
Surface unusual trades and related signals for review.
- 04Explore
Inspect alerts, analytics, and trader context in the terminal.
Keep the trail visible.
The terminal presents a scan, discover, and follow path. Filters narrow the alert table by market category, while lookup links make individual activity inspectable. The analytics dashboard separates market overview, detailed charts, and advanced views.
A public, usable product.
Visitors can browse the live alerts table, inspect market analytics, and open trader views. The dashboard also links to a Metabase workspace.
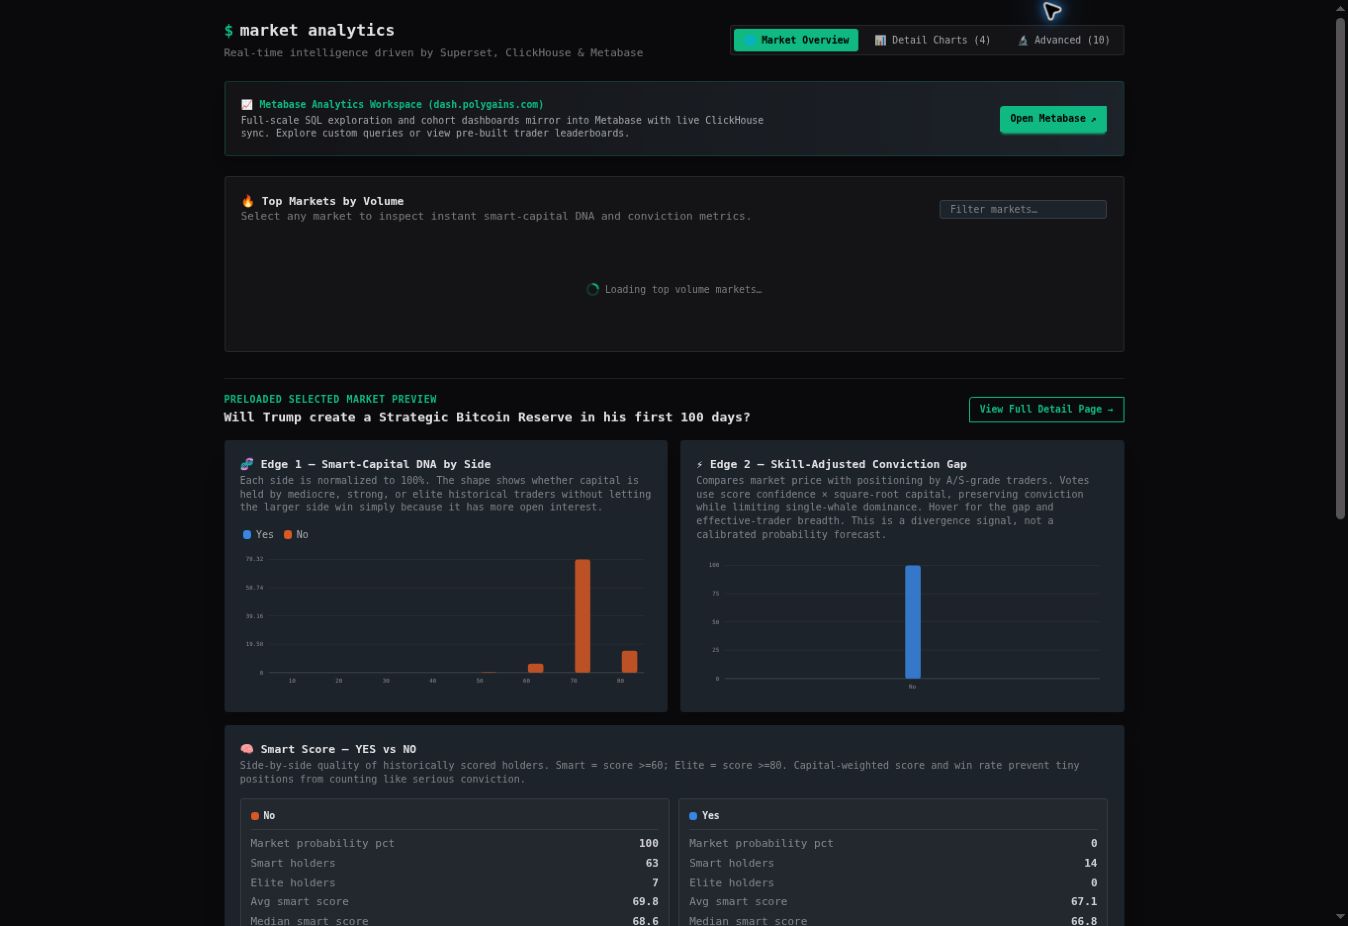
See the product in context.
Open the live terminal to explore the current data, or get in touch to discuss the engineering work.